
Table of contents:
Learn how to trade stocks, and you’ll unlock the potential to grow your wealth, but navigating the stock market can feel daunting. This guide will equip you with the knowledge and tools to make informed decisions and confidently navigate the world of trading. We’ll cover everything from understanding the basics of the stock market to developing effective trading strategies and managing your risk.
We’ll delve into fundamental analysis, helping you evaluate companies based on their financial health and future prospects. You’ll also discover the power of technical analysis, where you’ll learn to read charts and identify potential buying and selling opportunities. We’ll explore different trading strategies, from day trading to long-term investing, so you can choose the approach that aligns with your risk tolerance and goals.
Understanding the Stock Market

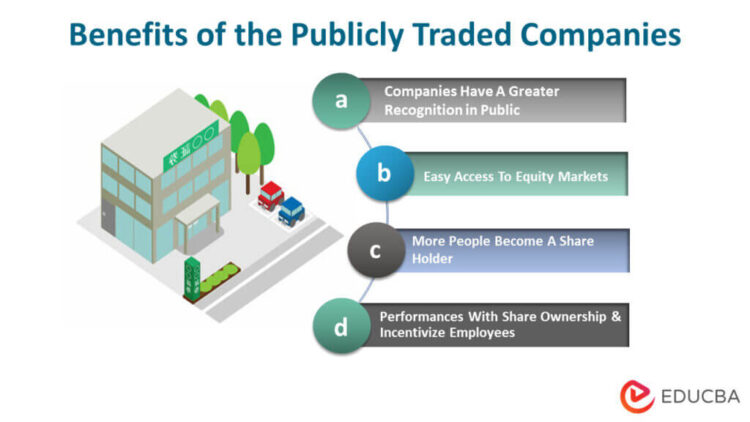
The stock market is a complex but fascinating system that allows individuals and institutions to buy and sell ownership shares of publicly traded companies. Understanding how it works is crucial for anyone interested in investing and building wealth. This section will delve into the basics of the stock market, explaining its key components and different types of stocks.
How the Stock Market Works
The stock market is a marketplace where buyers and sellers come together to trade shares of publicly listed companies. When you buy a share of a company’s stock, you essentially become a part-owner of that company. The price of a stock is determined by supply and demand, meaning that the more people want to buy a particular stock, the higher its price will rise. Conversely, if more people are selling, the price will fall.
The stock market is facilitated by stock exchanges, which are organized marketplaces where stocks are bought and sold. These exchanges provide a platform for trading, ensuring transparency and fairness in the process.
Types of Stocks
There are different types of stocks available in the market, each with its unique characteristics and investment implications.
- Common Stock: This is the most common type of stock, representing ownership in a company and granting voting rights to shareholders. Common stockholders receive dividends, if declared by the company, based on the company’s performance.
- Preferred Stock: Preferred stock offers investors a fixed dividend payment, which takes priority over common stock dividends. However, preferred stockholders generally do not have voting rights.
- Blue-Chip Stocks: These are stocks of large, well-established companies with a long history of profitability and consistent dividend payments. They are often considered safer investments compared to smaller, newer companies.
Popular Stock Exchanges
The stock market is a global phenomenon, with various exchanges operating across different countries. Here are some of the most popular stock exchanges worldwide:
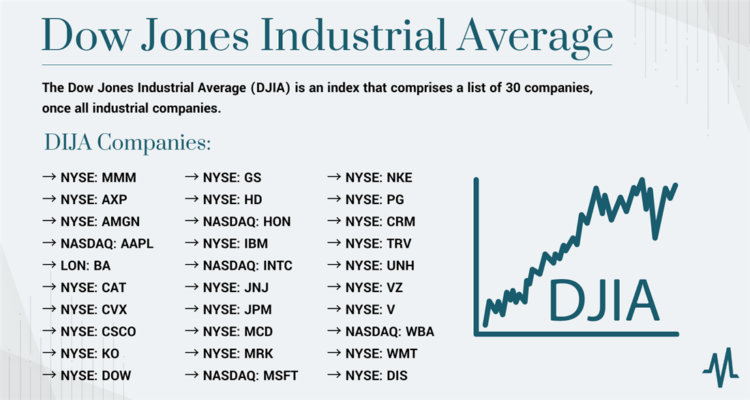
- New York Stock Exchange (NYSE): The NYSE is the largest stock exchange in the world by market capitalization, known for its traditional trading floor and listing of some of the biggest and most well-known companies in the world.
- Nasdaq Stock Market (Nasdaq): Nasdaq is a global electronic marketplace for stocks, known for its focus on technology and growth companies. It is the second-largest stock exchange in the world.
- London Stock Exchange (LSE): The LSE is the leading stock exchange in Europe, known for its international reach and diverse range of listed companies.
Fundamental Analysis
Fundamental analysis is a method of evaluating a company’s intrinsic value by examining its financial statements, industry dynamics, and overall economic conditions. It helps investors make informed decisions about buying, selling, or holding stocks by assessing the company’s past performance, current financial health, and future prospects.
Financial Statements
Financial statements are the foundation of fundamental analysis. They provide a comprehensive overview of a company’s financial performance, including its revenue, expenses, assets, liabilities, and equity. Understanding these statements is crucial for assessing a company’s financial health and making sound investment decisions.
- Income Statement: The income statement, also known as the profit and loss (P&L) statement, summarizes a company’s revenues and expenses over a specific period. It reveals how much profit or loss a company generated during that period.
- Balance Sheet: The balance sheet provides a snapshot of a company’s assets, liabilities, and equity at a specific point in time. It highlights the company’s financial position and its ability to meet its financial obligations.
- Cash Flow Statement: The cash flow statement tracks the movement of cash in and out of a company over a specific period. It reveals how much cash a company generated from its operations, investments, and financing activities.
Analyzing Financial Statements
Analyzing financial statements involves examining key metrics and ratios to assess a company’s financial health. These metrics provide insights into a company’s profitability, efficiency, liquidity, and solvency.
Profitability Metrics
Profitability metrics measure a company’s ability to generate profits from its operations.
- Gross Profit Margin: This metric measures the percentage of revenue remaining after deducting the cost of goods sold. A higher gross profit margin indicates a company is efficiently managing its production costs.
- Operating Profit Margin: This metric measures the percentage of revenue remaining after deducting all operating expenses, including salaries, rent, and utilities. A higher operating profit margin indicates a company is effectively managing its overall operations.
- Net Profit Margin: This metric measures the percentage of revenue remaining after deducting all expenses, including interest and taxes. A higher net profit margin indicates a company is maximizing its profitability.
Efficiency Metrics
Efficiency metrics measure how effectively a company utilizes its assets to generate revenue and profits.
- Inventory Turnover Ratio: This metric measures how quickly a company sells its inventory. A higher inventory turnover ratio indicates efficient inventory management and reduced storage costs.
- Days Sales Outstanding (DSO): This metric measures the average number of days it takes a company to collect payment from its customers. A lower DSO indicates efficient collection processes and reduced risk of bad debts.
- Asset Turnover Ratio: This metric measures how effectively a company utilizes its assets to generate revenue. A higher asset turnover ratio indicates efficient asset utilization and maximized revenue generation.
Liquidity Metrics
Liquidity metrics measure a company’s ability to meet its short-term financial obligations.
- Current Ratio: This metric measures a company’s ability to pay its current liabilities with its current assets. A current ratio greater than 1 indicates sufficient liquidity to meet short-term obligations.
- Quick Ratio: This metric measures a company’s ability to pay its current liabilities with its most liquid assets, excluding inventory. A quick ratio greater than 1 indicates strong short-term liquidity.
Solvency Metrics
Solvency metrics measure a company’s ability to meet its long-term financial obligations.
- Debt-to-Equity Ratio: This metric measures the amount of debt a company has relative to its equity. A lower debt-to-equity ratio indicates a company relies less on debt financing and has a stronger financial foundation.
- Times Interest Earned (TIE) Ratio: This metric measures a company’s ability to cover its interest expenses with its earnings before interest and taxes (EBIT). A TIE ratio greater than 2 indicates a company has sufficient earnings to cover its interest obligations.
Valuation Metrics
Valuation metrics are used to assess a company’s intrinsic value based on its financial performance and future prospects. These metrics help investors determine whether a company’s stock is undervalued or overvalued.
- Price-to-Earnings (P/E) Ratio: This metric compares a company’s stock price to its earnings per share. A higher P/E ratio suggests investors are willing to pay more for each dollar of earnings, potentially indicating high growth expectations or a premium valuation.
- Price-to-Book (P/B) Ratio: This metric compares a company’s stock price to its book value per share. A higher P/B ratio suggests investors are willing to pay more for each dollar of book value, potentially indicating strong brand value or intangible assets.
- Price-to-Sales (P/S) Ratio: This metric compares a company’s stock price to its revenue per share. A higher P/S ratio suggests investors are willing to pay more for each dollar of revenue, potentially indicating high growth potential or a premium valuation.
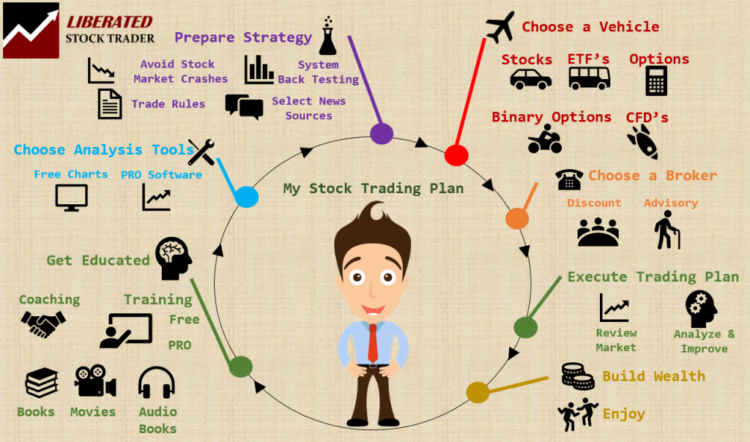
Trading Strategies
Trading strategies are the blueprints that guide investors in making decisions about buying and selling stocks. They provide a framework for navigating the complexities of the stock market, helping investors to manage risk, achieve their investment goals, and maximize their returns. Choosing the right trading strategy depends on individual risk tolerance, investment goals, and time horizon.
Day Trading
Day trading involves buying and selling stocks within the same trading day. Day traders aim to profit from short-term price fluctuations, often leveraging technical analysis to identify trends and entry/exit points.
- High-Frequency Trading: This strategy involves using computer algorithms to execute trades at lightning speed, exploiting minute price differences to generate profits.
- Scalping: Scalping involves taking advantage of small price movements, entering and exiting trades quickly to capture small profits.
- News Trading: News traders react to news events that can significantly impact stock prices, buying or selling based on the anticipated direction of the price movement.
Day trading is a high-risk, high-reward strategy, requiring significant capital, expertise, and dedication.
Swing Trading
Swing trading involves holding stocks for a few days to a few weeks, aiming to capture price swings or momentum. Swing traders utilize both technical and fundamental analysis to identify stocks that are likely to move in a particular direction.
- Trend Following: This strategy involves identifying stocks that are trending upward or downward and riding the wave of the trend.
- Breakout Trading: Breakout traders look for stocks that break out of a consolidation pattern, indicating a potential surge in price.
- Pullback Trading: This strategy involves buying stocks that have pulled back from a recent high, expecting them to bounce back.
Swing trading offers a more balanced risk-reward profile compared to day trading, allowing for a longer time horizon to manage trades.
Long-Term Investing, Learn how to trade stocks
Long-term investing involves holding stocks for several years or even decades, aiming to benefit from the long-term growth of companies and the overall stock market. Long-term investors typically focus on fundamental analysis, evaluating the financial health and future prospects of companies.
- Value Investing: Value investors seek undervalued stocks that are trading below their intrinsic value, believing that the market will eventually recognize their true worth.
- Growth Investing: Growth investors focus on companies with high growth potential, expecting their earnings and share prices to increase rapidly.
- Index Investing: Index investors invest in a diversified portfolio of stocks that track a specific market index, such as the S&P 500, providing broad market exposure and lower risk.
Long-term investing is a low-risk, low-reward strategy that requires patience and a long-term perspective.
Comparing Trading Strategies
| Strategy | Risk Profile | Time Horizon | Investment Goals |
|---|---|---|---|
| Day Trading | High | Short-term (intraday) | Short-term profits |
| Swing Trading | Moderate | Medium-term (days to weeks) | Medium-term gains |
| Long-Term Investing | Low | Long-term (years to decades) | Long-term wealth building |
Examples of Successful Trading Strategies
- Warren Buffett’s Value Investing: Buffett’s strategy involves identifying undervalued companies with strong fundamentals and holding them for the long term, generating substantial returns over decades.
- George Soros’s Macro Trading: Soros’s strategy focuses on identifying global macroeconomic trends and exploiting them through currency and other asset trades, achieving significant profits during periods of market volatility.
- Renaissance Technologies’ Quantitative Trading: This firm uses sophisticated algorithms and statistical models to identify trading opportunities and execute trades at high speed, generating impressive returns in various markets.
Risk Management

In the world of stock trading, where fortunes can be made and lost in the blink of an eye, risk management stands as a cornerstone of success. It’s not about avoiding risk altogether; it’s about understanding, managing, and controlling it to protect your hard-earned capital. Without a solid risk management plan, even the most well-informed trading decisions can lead to devastating losses.
Stop-Loss Orders
Stop-loss orders are a crucial tool for limiting potential losses. They are pre-set instructions to automatically sell a stock when it reaches a certain price point. This way, you can define your maximum acceptable loss on a trade. Imagine you bought 100 shares of a company at $50 per share. You set a stop-loss order at $45, meaning if the stock price falls to $45, your order will automatically execute, selling your shares and limiting your loss to $5 per share or $500 total. Stop-loss orders can be particularly helpful in volatile markets or when you’re unsure of a stock’s future direction.
Position Sizing
Position sizing is about determining how much money to allocate to each trade. It’s a key element of risk management because it dictates how much you stand to lose or gain on a particular trade. The general principle is to avoid putting too much capital at risk on a single trade. Instead, aim for a balanced approach that allows for potential gains while minimizing potential losses. For instance, if your account has $10,000, you might decide to risk only 2% of your capital on a single trade, which would be $200. This way, even if the trade goes against you, your overall portfolio is not severely impacted.
Diversification
Diversification is the practice of spreading your investments across different asset classes, industries, and even geographical regions. This strategy helps mitigate portfolio risk by reducing the impact of any single investment’s performance. Instead of putting all your eggs in one basket, you distribute them across multiple baskets. For example, a diversified portfolio might include stocks, bonds, real estate, and commodities. If one asset class performs poorly, the others might offset those losses, providing a cushion against significant overall portfolio losses. Diversification is an essential risk management technique for long-term investors who want to minimize the impact of market volatility.
Wrap-Up

With the right knowledge, tools, and discipline, you can unlock the potential of the stock market. Remember, trading involves risk, so managing your risk effectively is crucial. This guide will empower you to make informed decisions, develop your trading skills, and navigate the stock market with confidence. So, are you ready to learn how to trade stocks? Let’s get started!
FAQs: Learn How To Trade Stocks
What is the minimum amount of money I need to start trading stocks?
There’s no set minimum, but most brokers have low account minimums, often around $0. You can start with a small amount and gradually increase your investments as you gain experience and confidence.
What are the best resources for learning more about stock trading?
There are many excellent resources available, including online courses, books, and websites dedicated to stock trading education. You can also find valuable information from reputable financial institutions and professional investors.
How can I stay up-to-date on market news and trends?
Follow reputable financial news sources, such as Bloomberg, CNBC, and The Wall Street Journal. You can also subscribe to financial newsletters and podcasts for insights and analysis.