How to calculate stock price is a question that many investors ask themselves. It’s not as simple as looking at the current price on a stock exchange. You need to understand the underlying value of a company and its potential for growth. There are many factors to consider, including the company’s financial health, industry trends, and market sentiment. In this guide, we’ll walk you through the process of calculating stock price using a combination of fundamental and technical analysis.
We’ll start by exploring fundamental analysis, which involves examining a company’s financial statements and other relevant data to assess its intrinsic value. Then, we’ll move on to technical analysis, which uses charts and other indicators to identify potential buy and sell signals. Finally, we’ll put it all together and show you how to calculate a stock price using a real-world example.
Analyzing Company Performance
To understand how to calculate stock price, it’s crucial to analyze the company’s performance. This involves looking at its financial health, growth prospects, and competitive position. By understanding these factors, you can get a better idea of the company’s future value and make informed investment decisions.
Revenue and Profitability
A company’s revenue represents the total amount of money it earns from its operations. Analyzing revenue growth helps assess a company’s ability to generate sales and expand its market share. Profitability, on the other hand, reflects the company’s ability to turn revenue into profit. Key metrics include:
- Revenue Growth: This measures the percentage change in revenue over a specific period. A consistent increase in revenue indicates strong sales performance and market demand.
- Gross Profit Margin: This metric shows the percentage of revenue remaining after deducting the cost of goods sold. A high gross profit margin indicates efficient production and strong pricing power.
- Operating Profit Margin: This metric shows the percentage of revenue remaining after deducting operating expenses. A high operating profit margin indicates efficient operations and cost management.
- Net Profit Margin: This metric shows the percentage of revenue remaining after deducting all expenses, including taxes and interest. A high net profit margin indicates strong overall profitability.
By comparing these metrics to industry averages and historical trends, investors can gain insights into a company’s financial health and its potential for future growth.
Growth Potential
Analyzing a company’s growth potential involves evaluating its ability to expand its operations and generate future revenue. Key factors to consider include:
- Market Size and Growth: A company operating in a large and growing market has greater potential for expansion. Investors should research the target market’s size, growth rate, and future prospects.
- Product Innovation: Companies that develop innovative products or services have a competitive advantage and greater potential for growth. Look for companies with a strong research and development (R&D) pipeline and a track record of successful product launches.
- Expansion Strategies: Companies may pursue various strategies to grow, such as expanding into new markets, launching new product lines, or acquiring other companies. Investors should assess the feasibility and potential impact of these strategies.
Industry Trends and Competitive Landscape
Industry trends and the competitive landscape can significantly impact a company’s stock price. Investors need to understand the industry’s dynamics and how a company is positioned within it. Key factors to consider include:
- Industry Growth Rate: A growing industry provides opportunities for companies to expand their market share and increase revenue. Investors should look for industries with a healthy growth rate and strong long-term prospects.
- Competitive Intensity: A highly competitive industry can put pressure on a company’s profitability and pricing power. Investors should assess the number and strength of competitors, the intensity of rivalry, and the company’s competitive advantages.
- Regulatory Environment: Government regulations can impact a company’s operations and profitability. Investors should understand the regulatory landscape in the company’s industry and assess potential risks and opportunities.
Management Team
A company’s management team plays a critical role in its success. Investors should assess the team’s experience, expertise, and track record.
- Experience and Expertise: A management team with relevant industry experience and a proven track record of success can instill confidence in investors. Look for executives with deep knowledge of the company’s business, its markets, and its competitors.
- Leadership Style and Vision: Effective leadership is essential for driving growth and innovation. Investors should assess the management team’s vision for the company, their ability to inspire employees, and their commitment to long-term value creation.
- Compensation and Incentives: Management compensation should be aligned with shareholder interests. Investors should examine the company’s compensation structure and ensure that it incentivizes executives to focus on long-term growth and profitability.
Valuing a Company

After analyzing a company’s performance, the next step is to determine its value. This involves assessing the company’s future earnings potential and comparing it to its current market price. The goal is to understand whether the stock is undervalued, overvalued, or fairly priced.
Discounted Cash Flow (DCF) Analysis
DCF analysis is a fundamental valuation method that considers the present value of all future cash flows a company is expected to generate. It involves forecasting future cash flows and discounting them back to their present value using a discount rate that reflects the riskiness of the investment.
The key steps involved in DCF analysis include:
- Projecting Future Cash Flows: This involves analyzing the company’s historical financial statements and industry trends to forecast future cash flows. This can be done using various techniques, such as linear regression or statistical modeling.
- Determining the Discount Rate: This rate reflects the risk associated with investing in the company. It is often calculated using the Capital Asset Pricing Model (CAPM), which considers the risk-free rate, market risk premium, and the company’s beta (a measure of its volatility compared to the market).
- Calculating the Present Value of Cash Flows: The discounted cash flows are calculated by dividing each future cash flow by (1 + discount rate) raised to the power of the number of years in the future. This process discounts future cash flows to their present value, reflecting the time value of money.
- Summing the Present Values: The present values of all future cash flows are summed to arrive at the company’s intrinsic value. This represents the present value of all future cash flows the company is expected to generate.
The formula for calculating the present value of a future cash flow is:
Present Value = Future Cash Flow / (1 + Discount Rate)^Number of Years
Comparable Company Analysis
This method involves comparing the valuation metrics of a company to those of its peers. It is based on the principle that companies with similar characteristics should have similar valuations. By comparing a company’s valuation multiples (such as price-to-earnings ratio or price-to-sales ratio) to those of its peers, investors can gain insights into whether the company is undervalued or overvalued.
- Identify Comparable Companies: The first step is to identify companies that operate in the same industry and have similar business models, size, and financial performance. This involves researching industry databases and financial news sources.
- Gather Valuation Data: Once comparable companies are identified, their valuation multiples (such as price-to-earnings ratio, price-to-sales ratio, or price-to-book ratio) are collected. These data can be obtained from financial databases, stock analysis websites, or company filings.
- Calculate the Target Valuation: The target valuation is calculated by applying the average valuation multiple of the comparable companies to the company being analyzed. This gives an indication of the company’s intrinsic value based on market multiples.
Intrinsic Value and Stock Price
Intrinsic value refers to the true worth of a company based on its future earnings potential. It is an objective assessment of the company’s value, independent of market sentiment. Stock price, on the other hand, is the current market value of a company’s shares. It is determined by supply and demand in the market, which can be influenced by factors such as investor sentiment, news events, and market trends.
The difference between intrinsic value and stock price is known as the “margin of safety.” A large margin of safety suggests that the stock is undervalued, while a small margin of safety suggests that the stock is overvalued.
Market Factors and Stock Price
The price of a stock is not determined solely by the company’s performance. External market factors play a significant role in influencing stock price fluctuations. Understanding these factors is crucial for investors to make informed decisions.
Interest Rates
Interest rates directly impact the cost of borrowing money for companies. When interest rates rise, borrowing becomes more expensive, potentially leading to lower profits and reduced investment. Consequently, stock prices may decline as investors anticipate lower future earnings. Conversely, falling interest rates can boost stock prices as companies find it cheaper to borrow and invest, leading to potential growth and higher profits.
Inflation
Inflation, a general increase in prices, can impact stock prices in various ways. High inflation can erode the purchasing power of investors, making them less willing to invest in stocks. Additionally, inflation can lead to higher costs for companies, potentially reducing their profitability. Conversely, low inflation can boost stock prices as investors feel more confident about the economy and future earnings.
Market Sentiment and Investor Psychology
Market sentiment, or the overall feeling of investors towards the stock market, plays a crucial role in stock price movements. When investors are optimistic about the economy and future prospects, they tend to buy stocks, driving prices higher. Conversely, pessimistic sentiment can lead to selling pressure, pushing prices down. Investor psychology also influences stock prices. Fear and greed can drive irrational behavior, leading to bubbles and crashes.
News and Events, How to calculate stock price
News and events can significantly impact stock prices. Positive news, such as strong earnings reports, new product launches, or favorable industry developments, can boost stock prices. Conversely, negative news, such as declining profits, lawsuits, or regulatory changes, can lead to stock price declines. Major economic events, such as changes in government policies or geopolitical tensions, can also influence market sentiment and stock prices.
Technical Analysis
Technical analysis is a method of evaluating securities by analyzing market action, primarily price and volume. It assumes that past trading activity and price patterns can predict future price movements. Technical analysts use charts, patterns, and indicators to identify trends, support and resistance levels, and potential buy and sell signals.
Moving Averages
Moving averages are a widely used technical indicator that smooths out price fluctuations by calculating the average price over a specified period. This helps to identify trends and potential reversals.
- Simple Moving Average (SMA): The SMA is calculated by adding up the closing prices of a stock over a specified period and dividing by the number of periods. For example, a 20-day SMA would be the average of the closing prices for the past 20 trading days.
- Exponential Moving Average (EMA): The EMA gives more weight to recent prices than older prices, making it more responsive to price changes. It is calculated using a smoothing factor that determines the weighting of each price point.
When a stock price crosses above a moving average, it can be interpreted as a bullish signal, indicating that the price is likely to continue rising. Conversely, a crossing below the moving average is considered a bearish signal.
Relative Strength Index (RSI)
The RSI is a momentum indicator that measures the magnitude of recent price changes to evaluate overbought or oversold conditions in the market. It is calculated on a scale of 0 to 100, with readings above 70 generally considered overbought and readings below 30 considered oversold.
RSI = 100 – (100 / (1 + (Average Gain / Average Loss)))
The RSI can help traders identify potential turning points in a stock’s price. For example, a stock with an RSI above 70 may be due for a correction, while a stock with an RSI below 30 may be a good buying opportunity.
Identifying Buy and Sell Signals
Technical analysis can be used to identify potential buy and sell signals by observing chart patterns, trendlines, and indicator readings.
- Trendlines: Trendlines are lines drawn on a chart to connect price highs or lows, representing the direction of the trend. A break above a resistance trendline can signal a bullish breakout, while a break below a support trendline can indicate a bearish breakdown.
- Chart Patterns: Certain chart patterns, such as head and shoulders, double tops, and triple bottoms, can suggest potential reversals in the market. For example, a head and shoulders pattern is a bearish reversal pattern that indicates a potential decline in price.
- Indicator Crossovers: Crossovers between different technical indicators, such as moving averages, can provide buy and sell signals. For example, a crossover of a short-term moving average above a long-term moving average can be interpreted as a bullish signal, while a crossover below can indicate a bearish signal.
Calculating Stock Price with Example
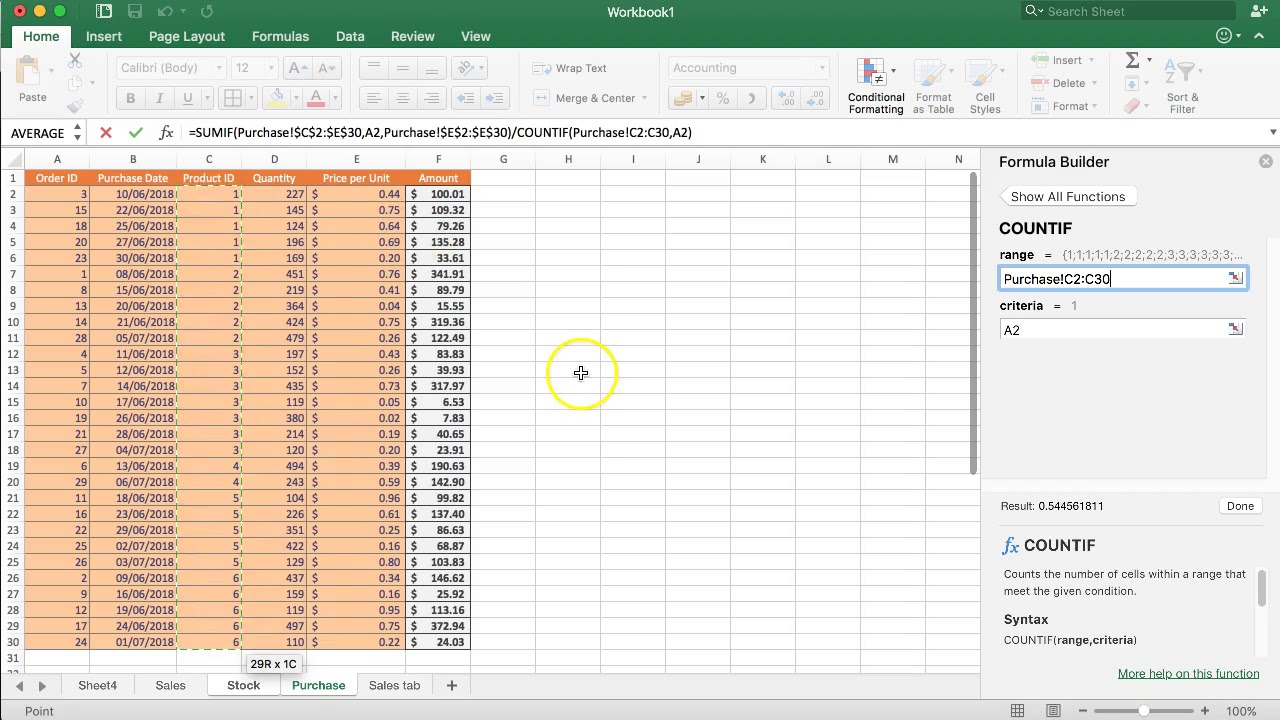
Calculating a stock price can seem complex, but it’s essentially about assessing a company’s value and reflecting that value in a per-share price. Several methods exist, and each relies on different assumptions and data. This section will showcase a simplified example using the most common method: discounted cash flow (DCF) analysis.
DCF Analysis Example
DCF analysis estimates a company’s intrinsic value by discounting its future cash flows back to the present. This method is often used by investors to determine if a stock is undervalued or overvalued.
Here’s a hypothetical example of how to calculate a stock price using DCF analysis:
| Year | Revenue | Profit | Growth Rate | Valuation Metrics | Estimated Stock Price |
|---|---|---|---|---|---|
| 2023 | $100 million | $20 million | 10% |
|
$200 |
| 2024 | $110 million | $22 million | 10% | $220 | |
| 2025 | $121 million | $24.2 million | 10% | $242 | |
| 2026 | $133.1 million | $26.62 million | 10% | $266.20 | |
| 2027+ | – | – | 2% | $273.42 |
Explanation:
1. Revenue and Profit Projections: We start with the company’s current revenue and profit. We project future revenue and profit based on an assumed growth rate of 10%. This growth rate is an estimate and can be adjusted based on industry trends, company performance, and other factors.
2. Discount Rate: The discount rate represents the required return an investor expects from their investment. This rate accounts for the time value of money, meaning money today is worth more than money in the future due to inflation and opportunity cost. In this example, we use a discount rate of 10%.
3. Terminal Growth Rate: The terminal growth rate is the assumed growth rate for the company’s cash flows after the explicit forecast period. This rate is typically lower than the initial growth rate and reflects a more sustainable growth trajectory. In this example, we use a terminal growth rate of 2%.
4. Calculating Present Value: We discount each year’s projected profit back to the present using the discount rate. For example, the present value of the 2024 profit of $22 million is $20 million (calculated as $22 million / (1 + 10%)).
5. Terminal Value: We calculate the terminal value, which represents the present value of all future cash flows beyond the explicit forecast period. This is done by dividing the final year’s profit by the difference between the discount rate and the terminal growth rate. In this example, the terminal value is $273.42 million (calculated as $26.62 million / (10% – 2%)).
6. Summing Present Values: We sum the present values of all projected profits and the terminal value to arrive at the total present value of the company. In this example, the total present value is $973.04 million.
7. Estimated Stock Price: We divide the total present value by the number of outstanding shares to arrive at the estimated stock price. If the company has 4.8 million shares outstanding, the estimated stock price would be $202.72 (calculated as $973.04 million / 4.8 million shares).
Note: This is a simplified example, and the actual stock price calculation can be much more complex. The example assumes a constant growth rate, a stable discount rate, and a single terminal growth rate. In reality, these factors can change over time, requiring more sophisticated models and analysis.
Wrap-Up

Calculating stock price isn’t an exact science, but by understanding the key factors and using the right tools, you can make more informed investment decisions. Remember, it’s important to do your own research and to consult with a financial advisor before making any investment decisions. Happy investing!
Quick FAQs: How To Calculate Stock Price
What is the difference between fundamental analysis and technical analysis?
Fundamental analysis focuses on the underlying value of a company, while technical analysis looks at price charts and other indicators to identify patterns and trends.
How do I find a company’s financial statements?
You can find a company’s financial statements on its website or on a financial data website like Yahoo Finance or Google Finance.
What are some common valuation metrics?
Some common valuation metrics include price-to-earnings ratio (P/E), price-to-book ratio (P/B), and price-to-sales ratio (P/S).
How do I use technical indicators?
Technical indicators can be used to identify potential buy and sell signals. For example, a moving average can be used to identify trends, while a relative strength index (RSI) can be used to identify overbought or oversold conditions.
